-> Elasticsearch security features have been automatically configured! -> Authentication is enabled and cluster connections are encrypted.
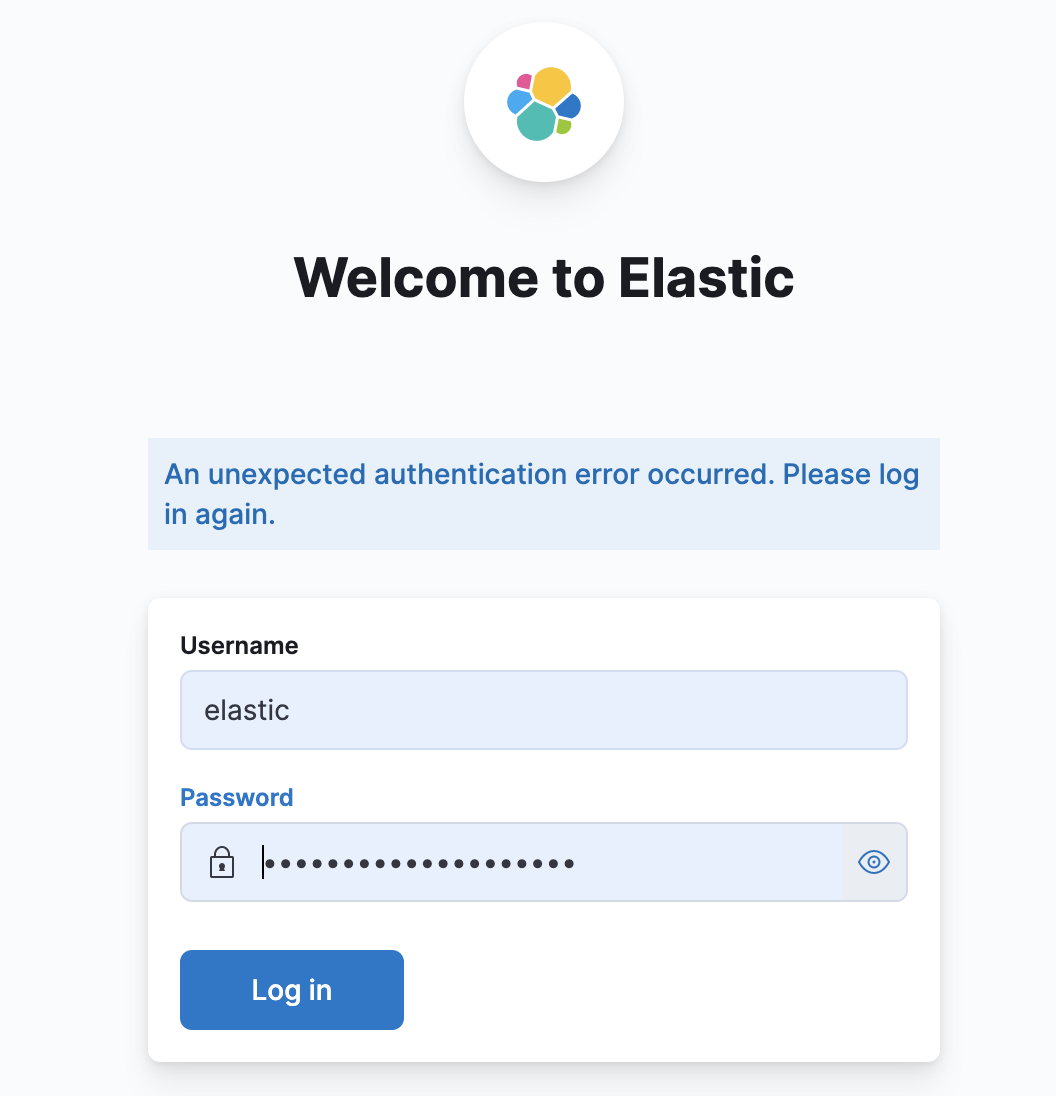
-> Password for the elastic user (reset with `bin/elasticsearch-reset-password -u elastic`): u8XQQ7GfBJ2+3u1sdtqK
-> HTTP CA certificate SHA-256 fingerprint: a144fde302e1849152b849d34fae5ca5b902b12ade0be05b195747e76151b55e
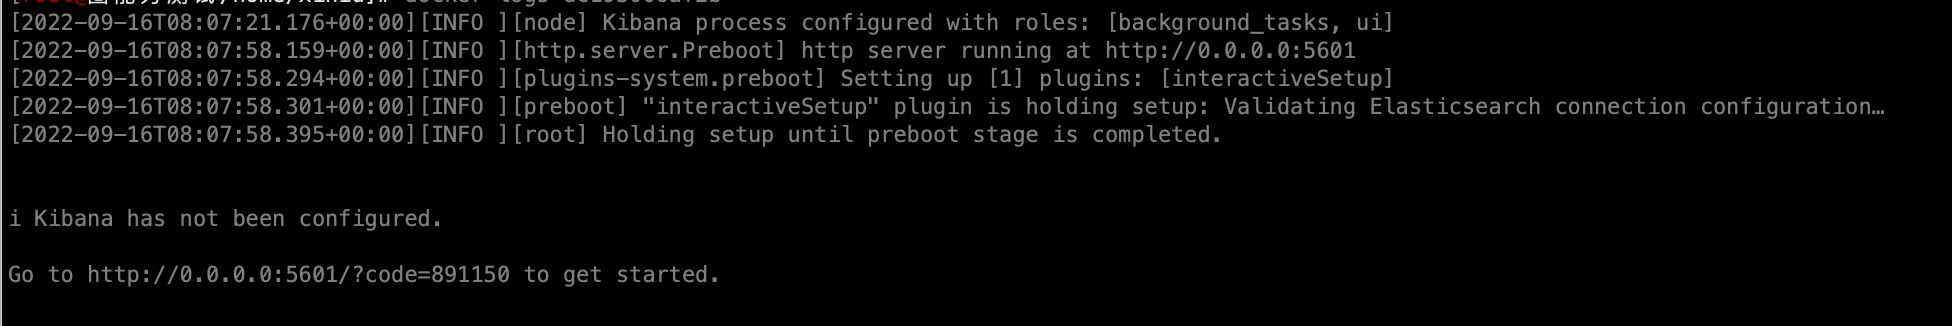
-> Configure Kibana to use this cluster:
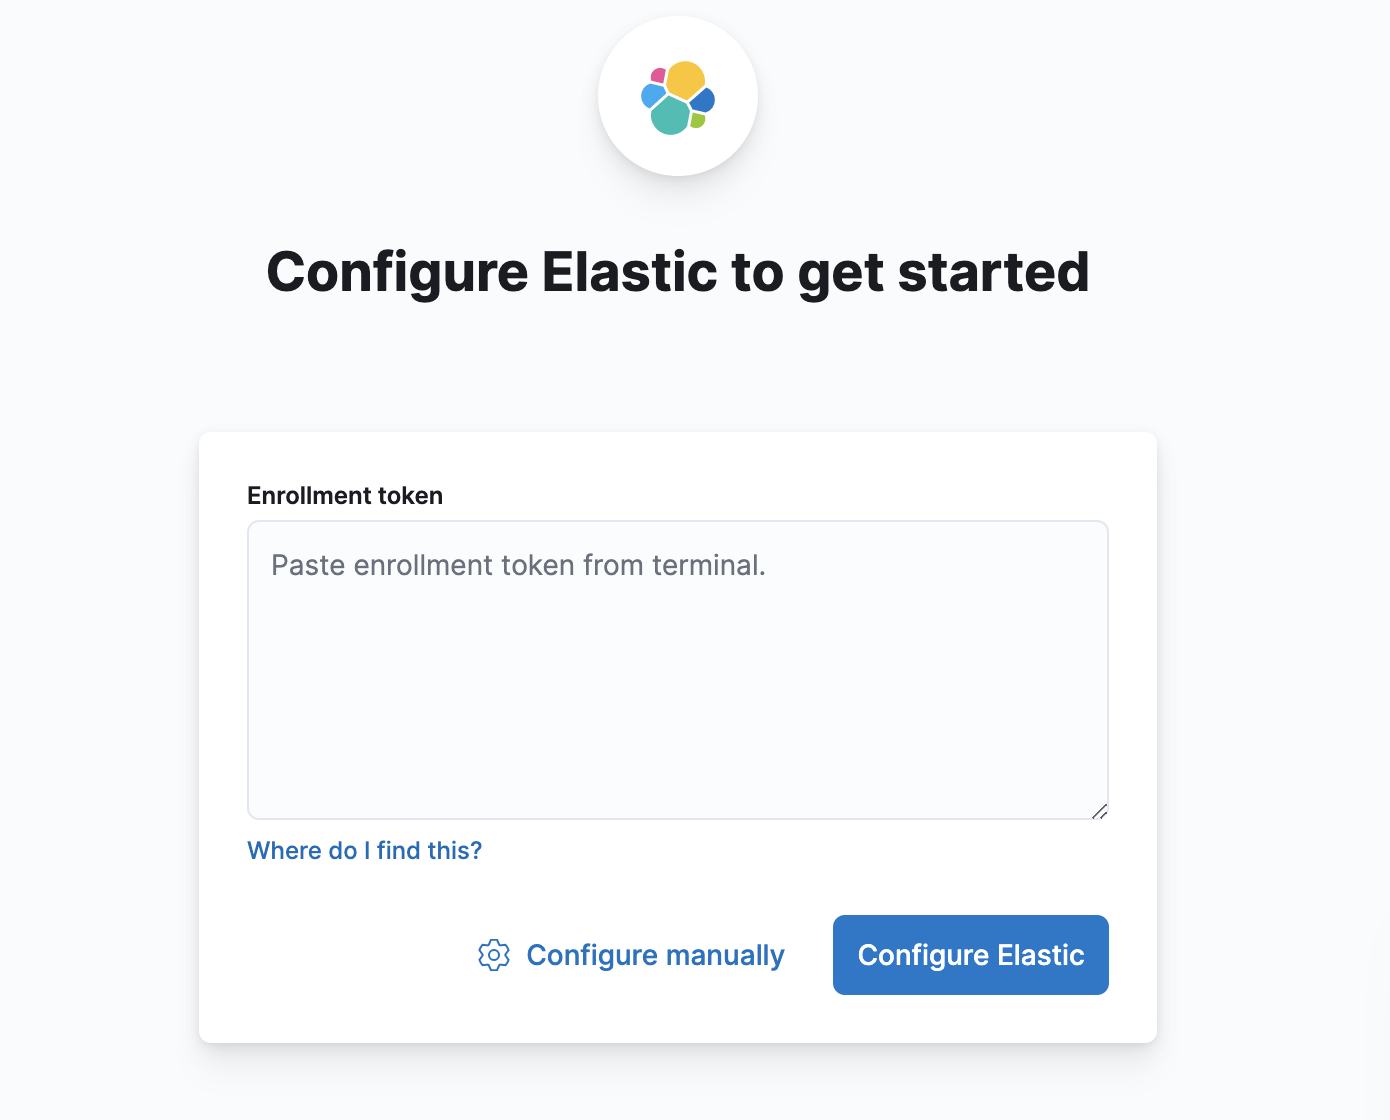
* Run Kibana and click the configuration link in the terminal when Kibana starts. * Copy the following enrollment token and paste it into Kibana in your browser (valid for the next 30 minutes): eyJ2ZXIiOiI4LjQuMSIsImFkciI6WyIxNzIuMTguMC4yOjkyMDAiXSwiZmdyIjoiYTE0NGZkZTMwMmUxODQ5MTUyYjg0OWQzNGZhZTVjYTViOTAyYjEyYWRlMGJlMDViMTk1NzQ3ZTc2MTUxYjU1ZSIsImtleSI6IllVTkJSWU1CSUxXcGp5WVJSNlpwOmg4bFFRcV9IUVV5WUoyeVJNUGZKalEifQ==
-> Configure other nodes to join this cluster:
* Copy the following enrollment token and start new Elasticsearch nodes with `bin/elasticsearch --enrollment-token <token>` (valid for the next 30 minutes): eyJ2ZXIiOiI4LjQuMSIsImFkciI6WyIxNzIuMTguMC4yOjkyMDAiXSwiZmdyIjoiYTE0NGZkZTMwMmUxODQ5MTUyYjg0OWQzNGZhZTVjYTViOTAyYjEyYWRlMGJlMDViMTk1NzQ3ZTc2MTUxYjU1ZSIsImtleSI6IlkwTkJSWU1CSUxXcGp5WVJSNlpyOmVOdXozY29TUW5tS3FyMU9IOEk0X0EifQ==
If you're running in Docker, copy the enrollment token and run: `docker run -e "ENROLLMENT_TOKEN=<token>" docker.elastic.co/elasticsearch/elasticsearch:8.4.1`